
Project information
- Category: Data Collection, Data Analysis, Data Visualization, Tableau, Job Market Analytics
- Project date: February, 2025
- Tableau: Job Applications Analysis
Introduction
Job Application Analysis is a data-driven project that tracks and analyzes personal job application journeys. This project creates a structured approach to understanding the job search process through comprehensive data collection and visualization.
- Application Tracking System
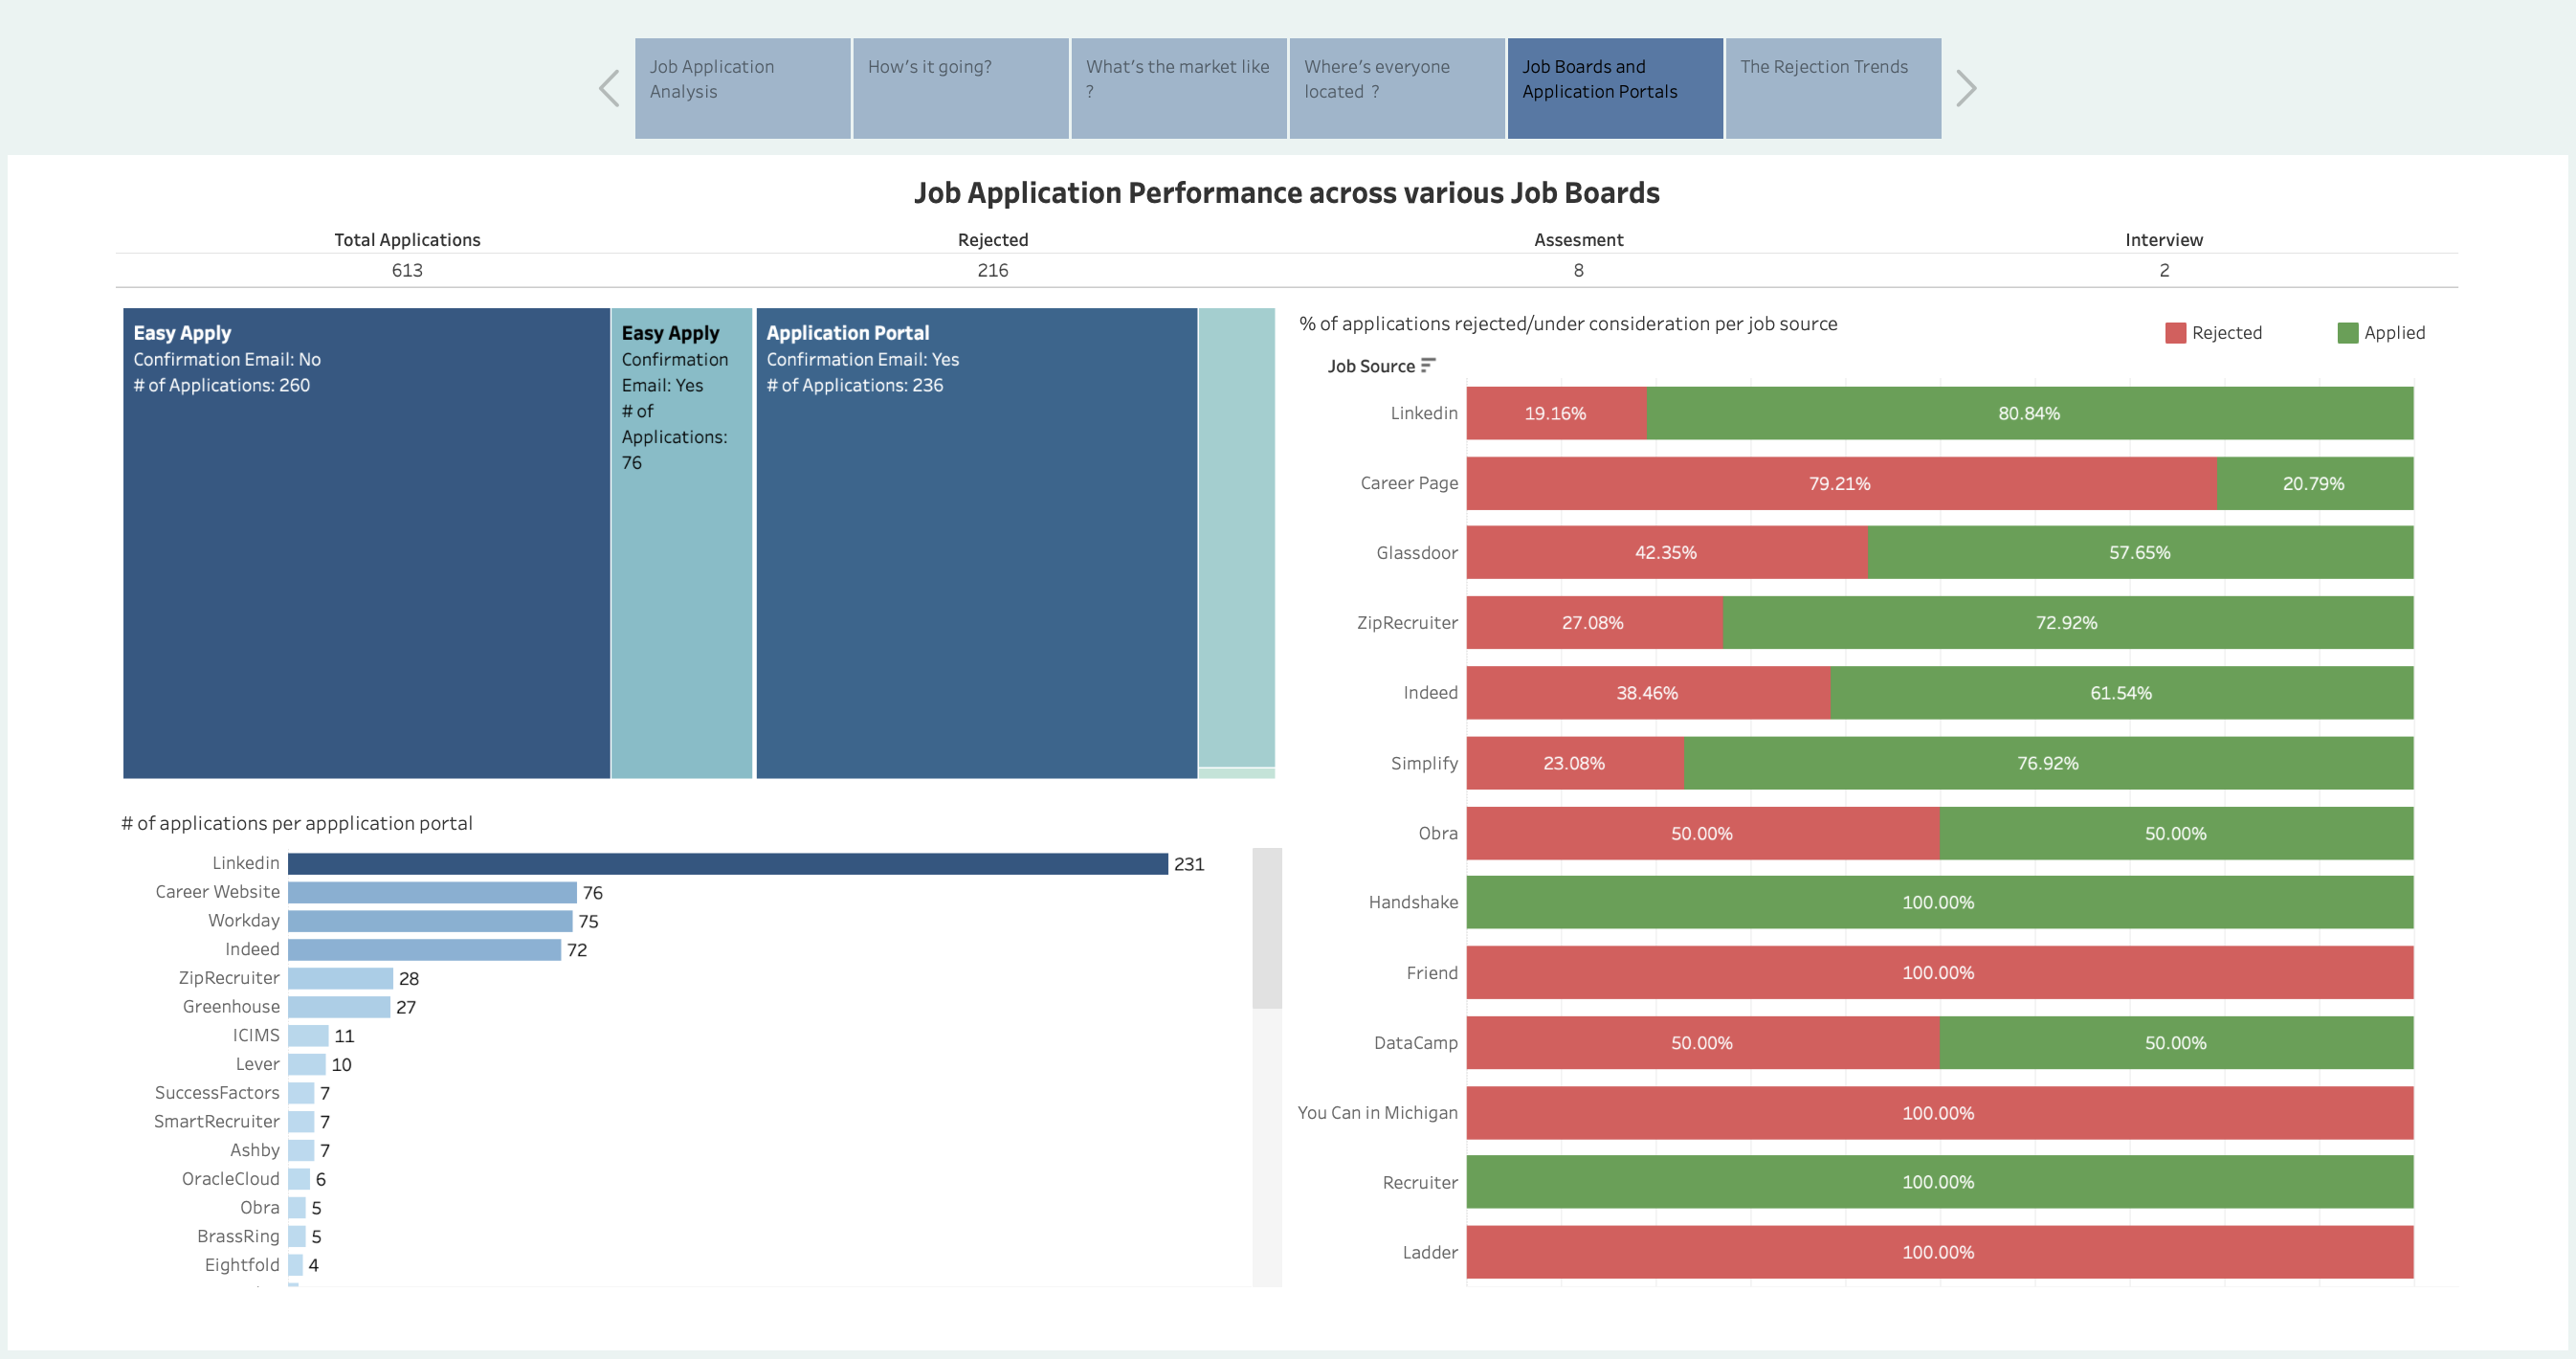
- Response Analysis
- Market Trend Identification
- Geographical Distribution
- Outcome Prediction
By meticulously tracking job applications across different dimensions, this project aims to uncover patterns in the job market and employer responses that can optimize future job search strategies.
The analysis incorporates various metrics such as application timelines, company characteristics, salary expectations, and communication patterns to provide a comprehensive view of the job search landscape.
Objective
The primary objective of this project was to systematically collect and analyze data from personal job applications to identify patterns, trends, and factors that influence job application outcomes. By creating a comprehensive tracking system and visual dashboard, the project aims to provide insights that can help optimize job search strategies, understand employer response behaviors, and identify the most promising opportunities in the job market.
Process
The job application analysis process involved several structured steps:
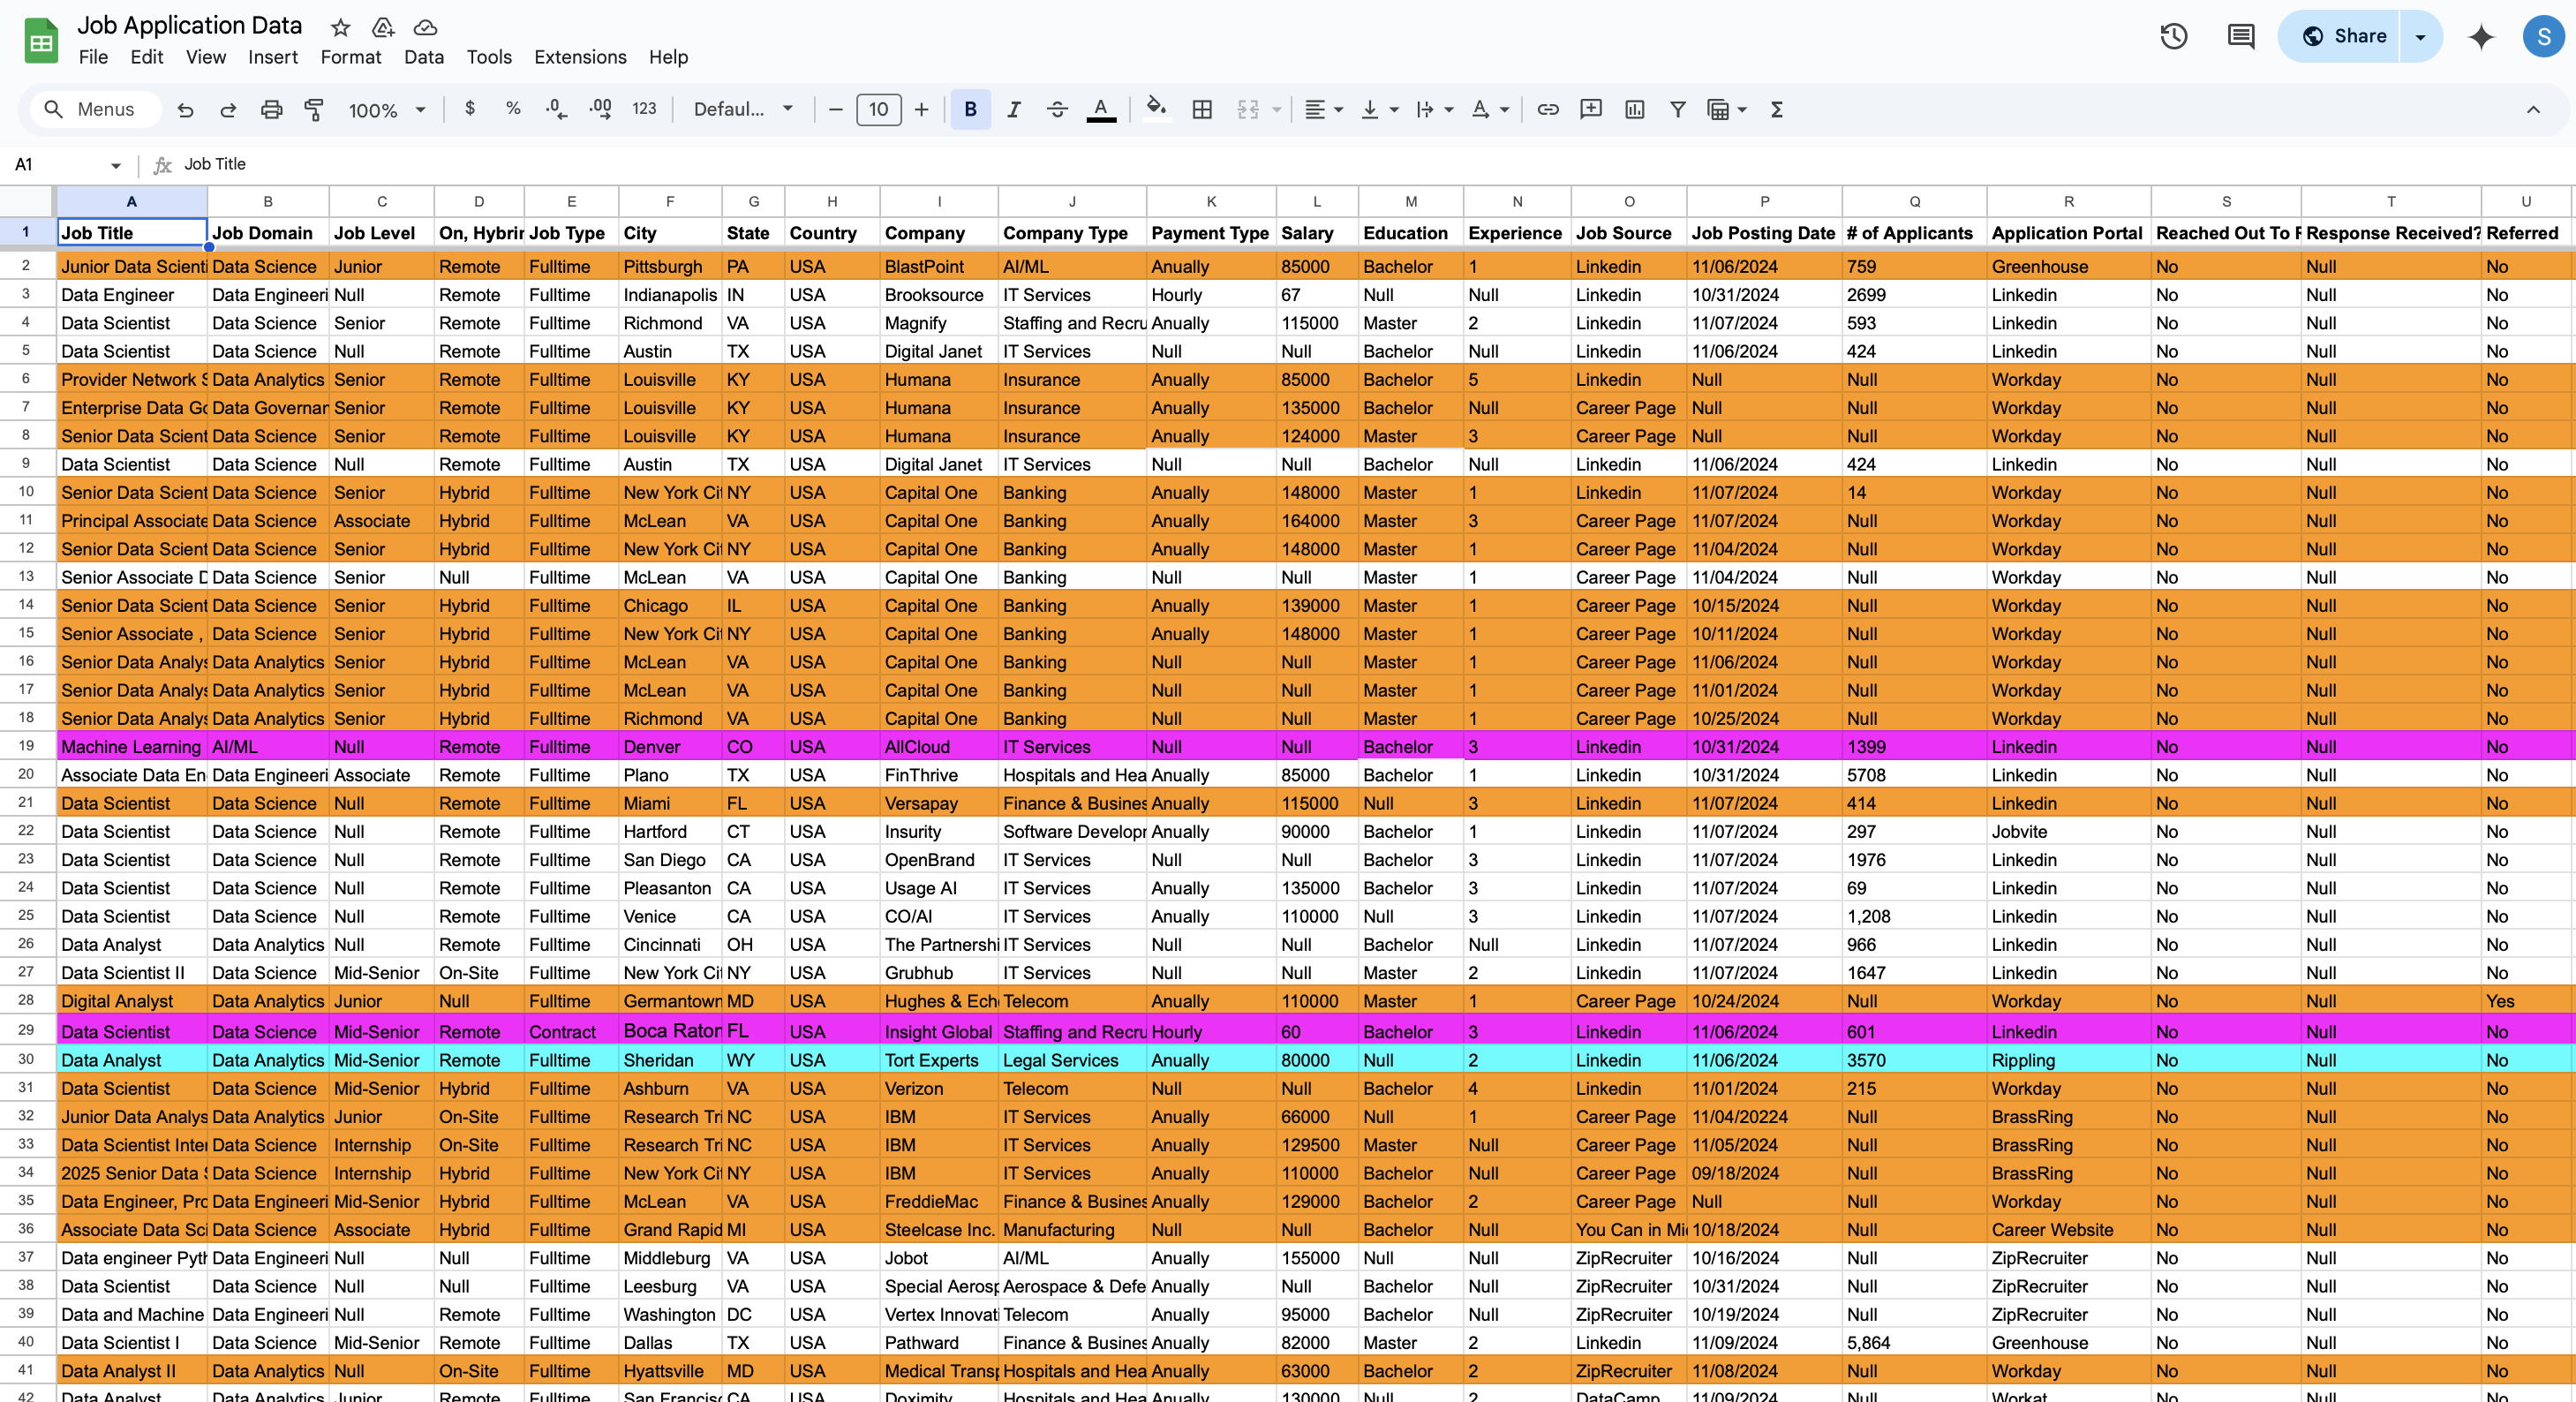
- Schema Design: Developed a comprehensive data collection schema to capture relevant details from each job application.
- Data Collection: Systematically recorded information for each job application including:
- Job title, company, company type, and location
- Compensation details (annual or hourly pay)
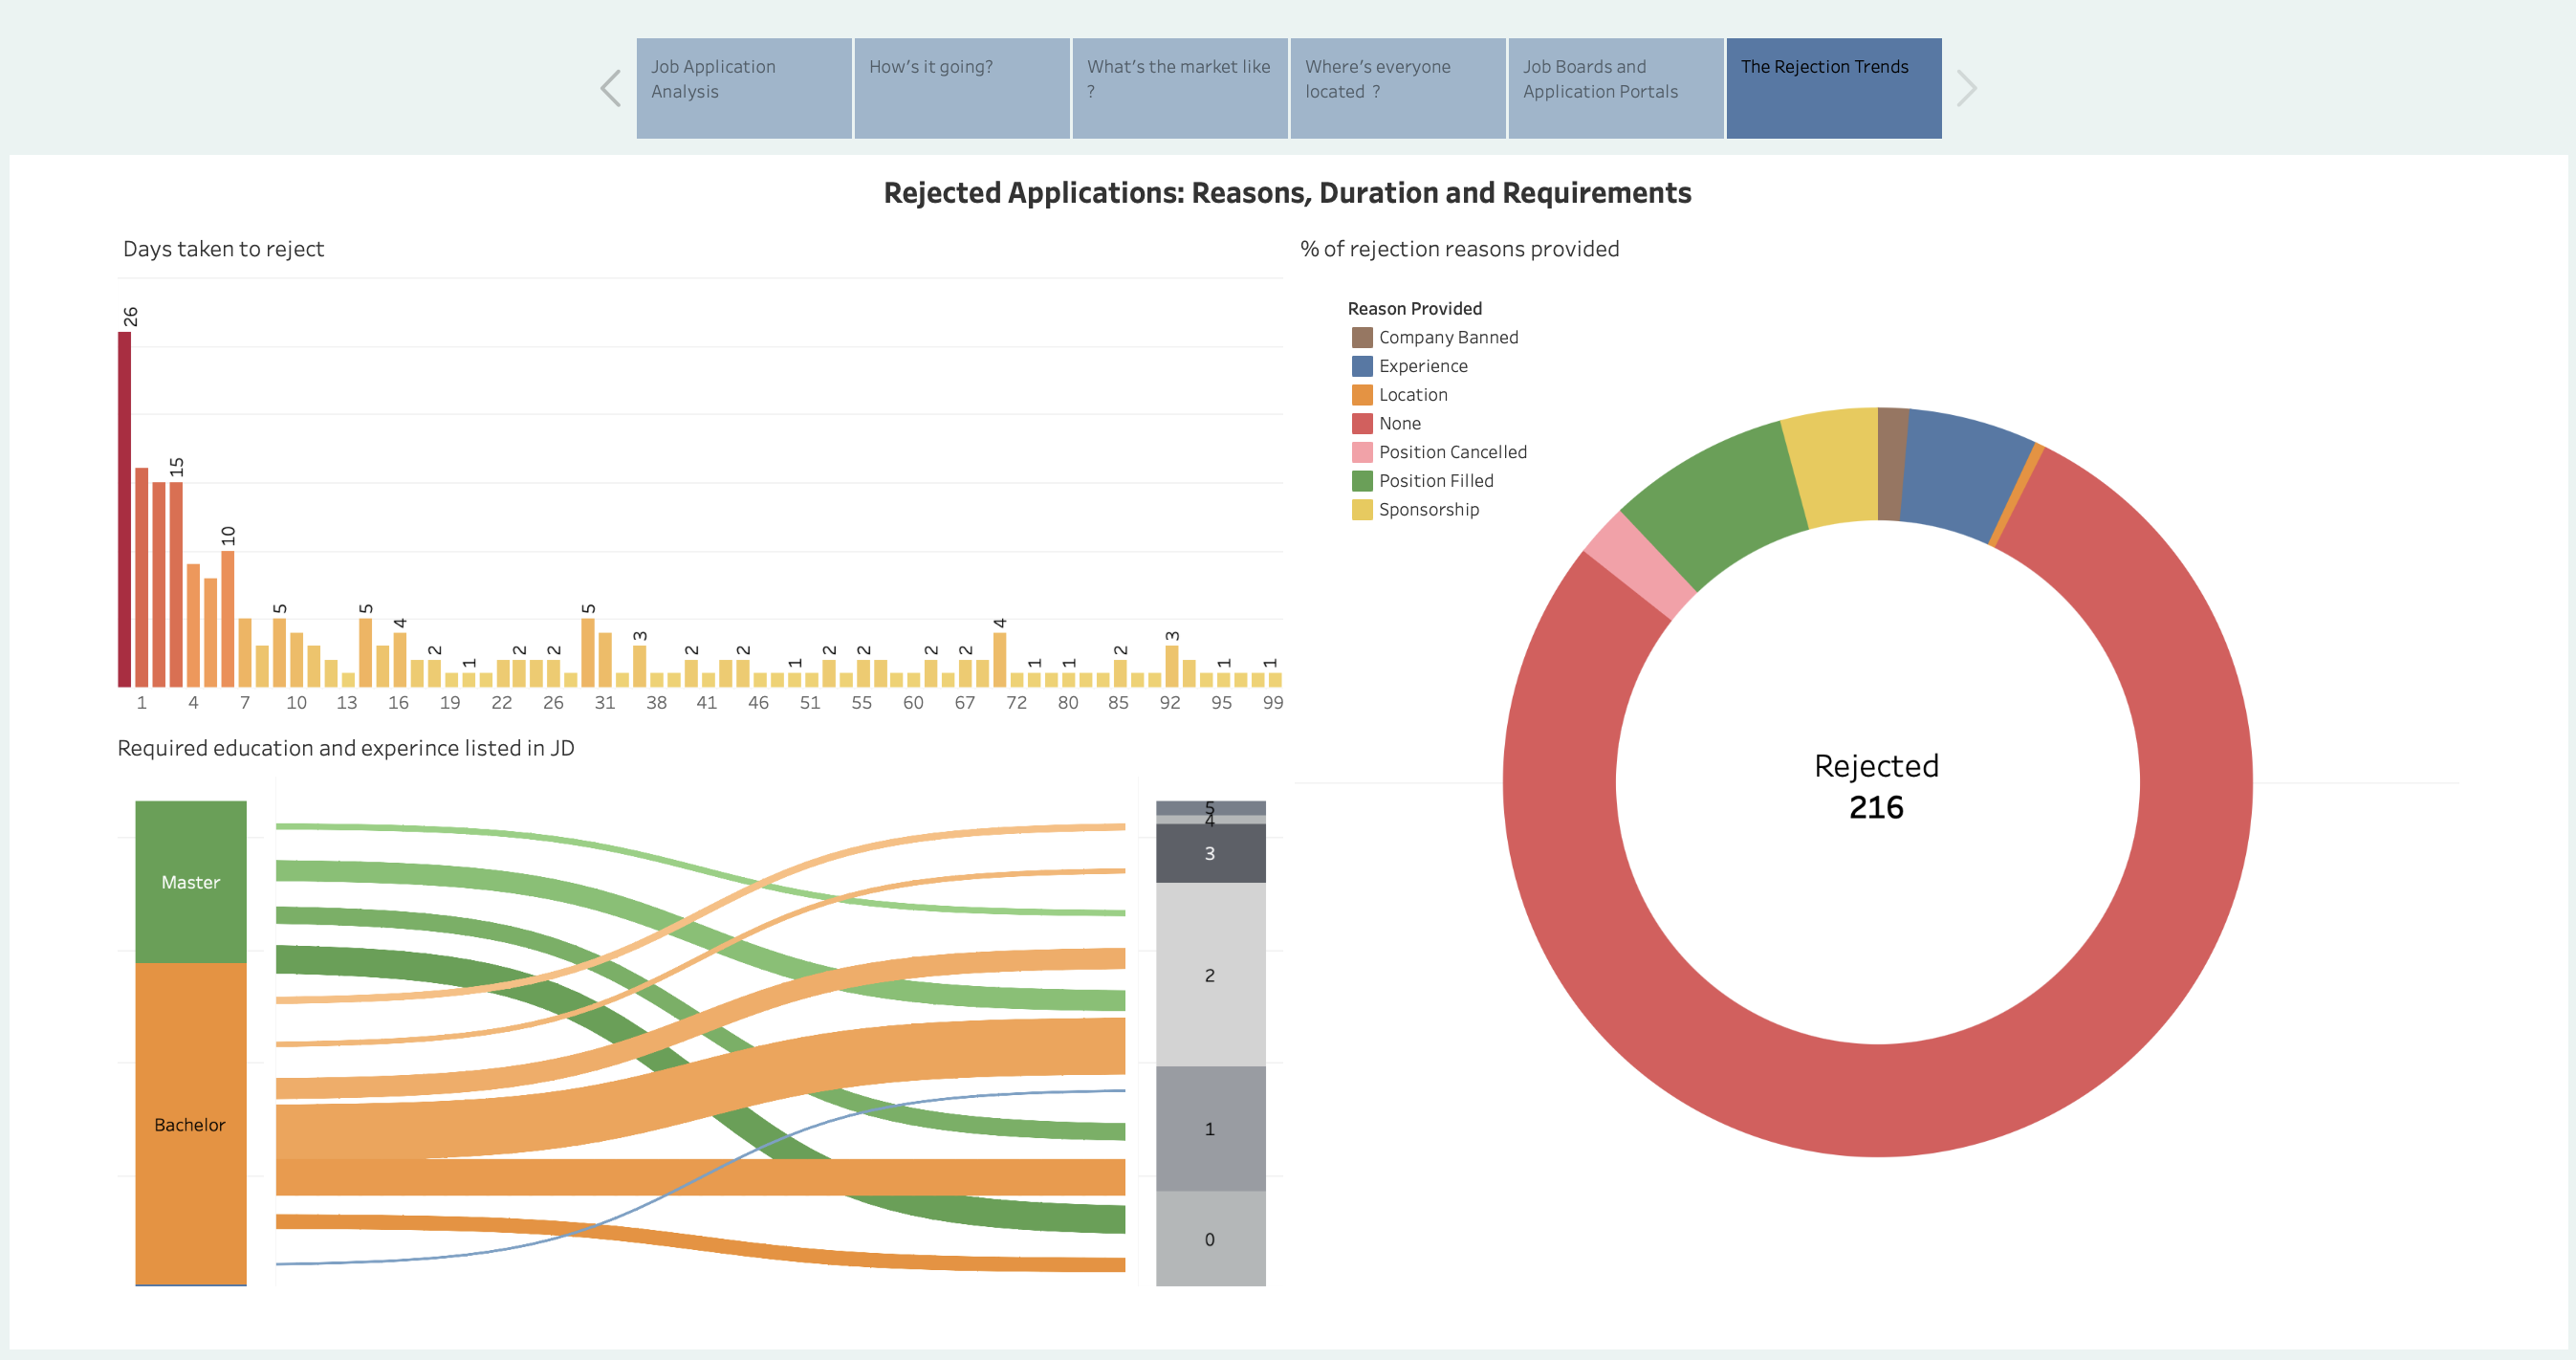
- Education and experience requirements
- Application dates and methods
- Employer communications and timeline
- Additional requirements (age, gender, disability, sponsorship)
- Interview processes and stages
- Rejection data including dates and stated reasons
- Data Cleaning: Standardized formats, addressed missing values, and ensured consistency across entries.
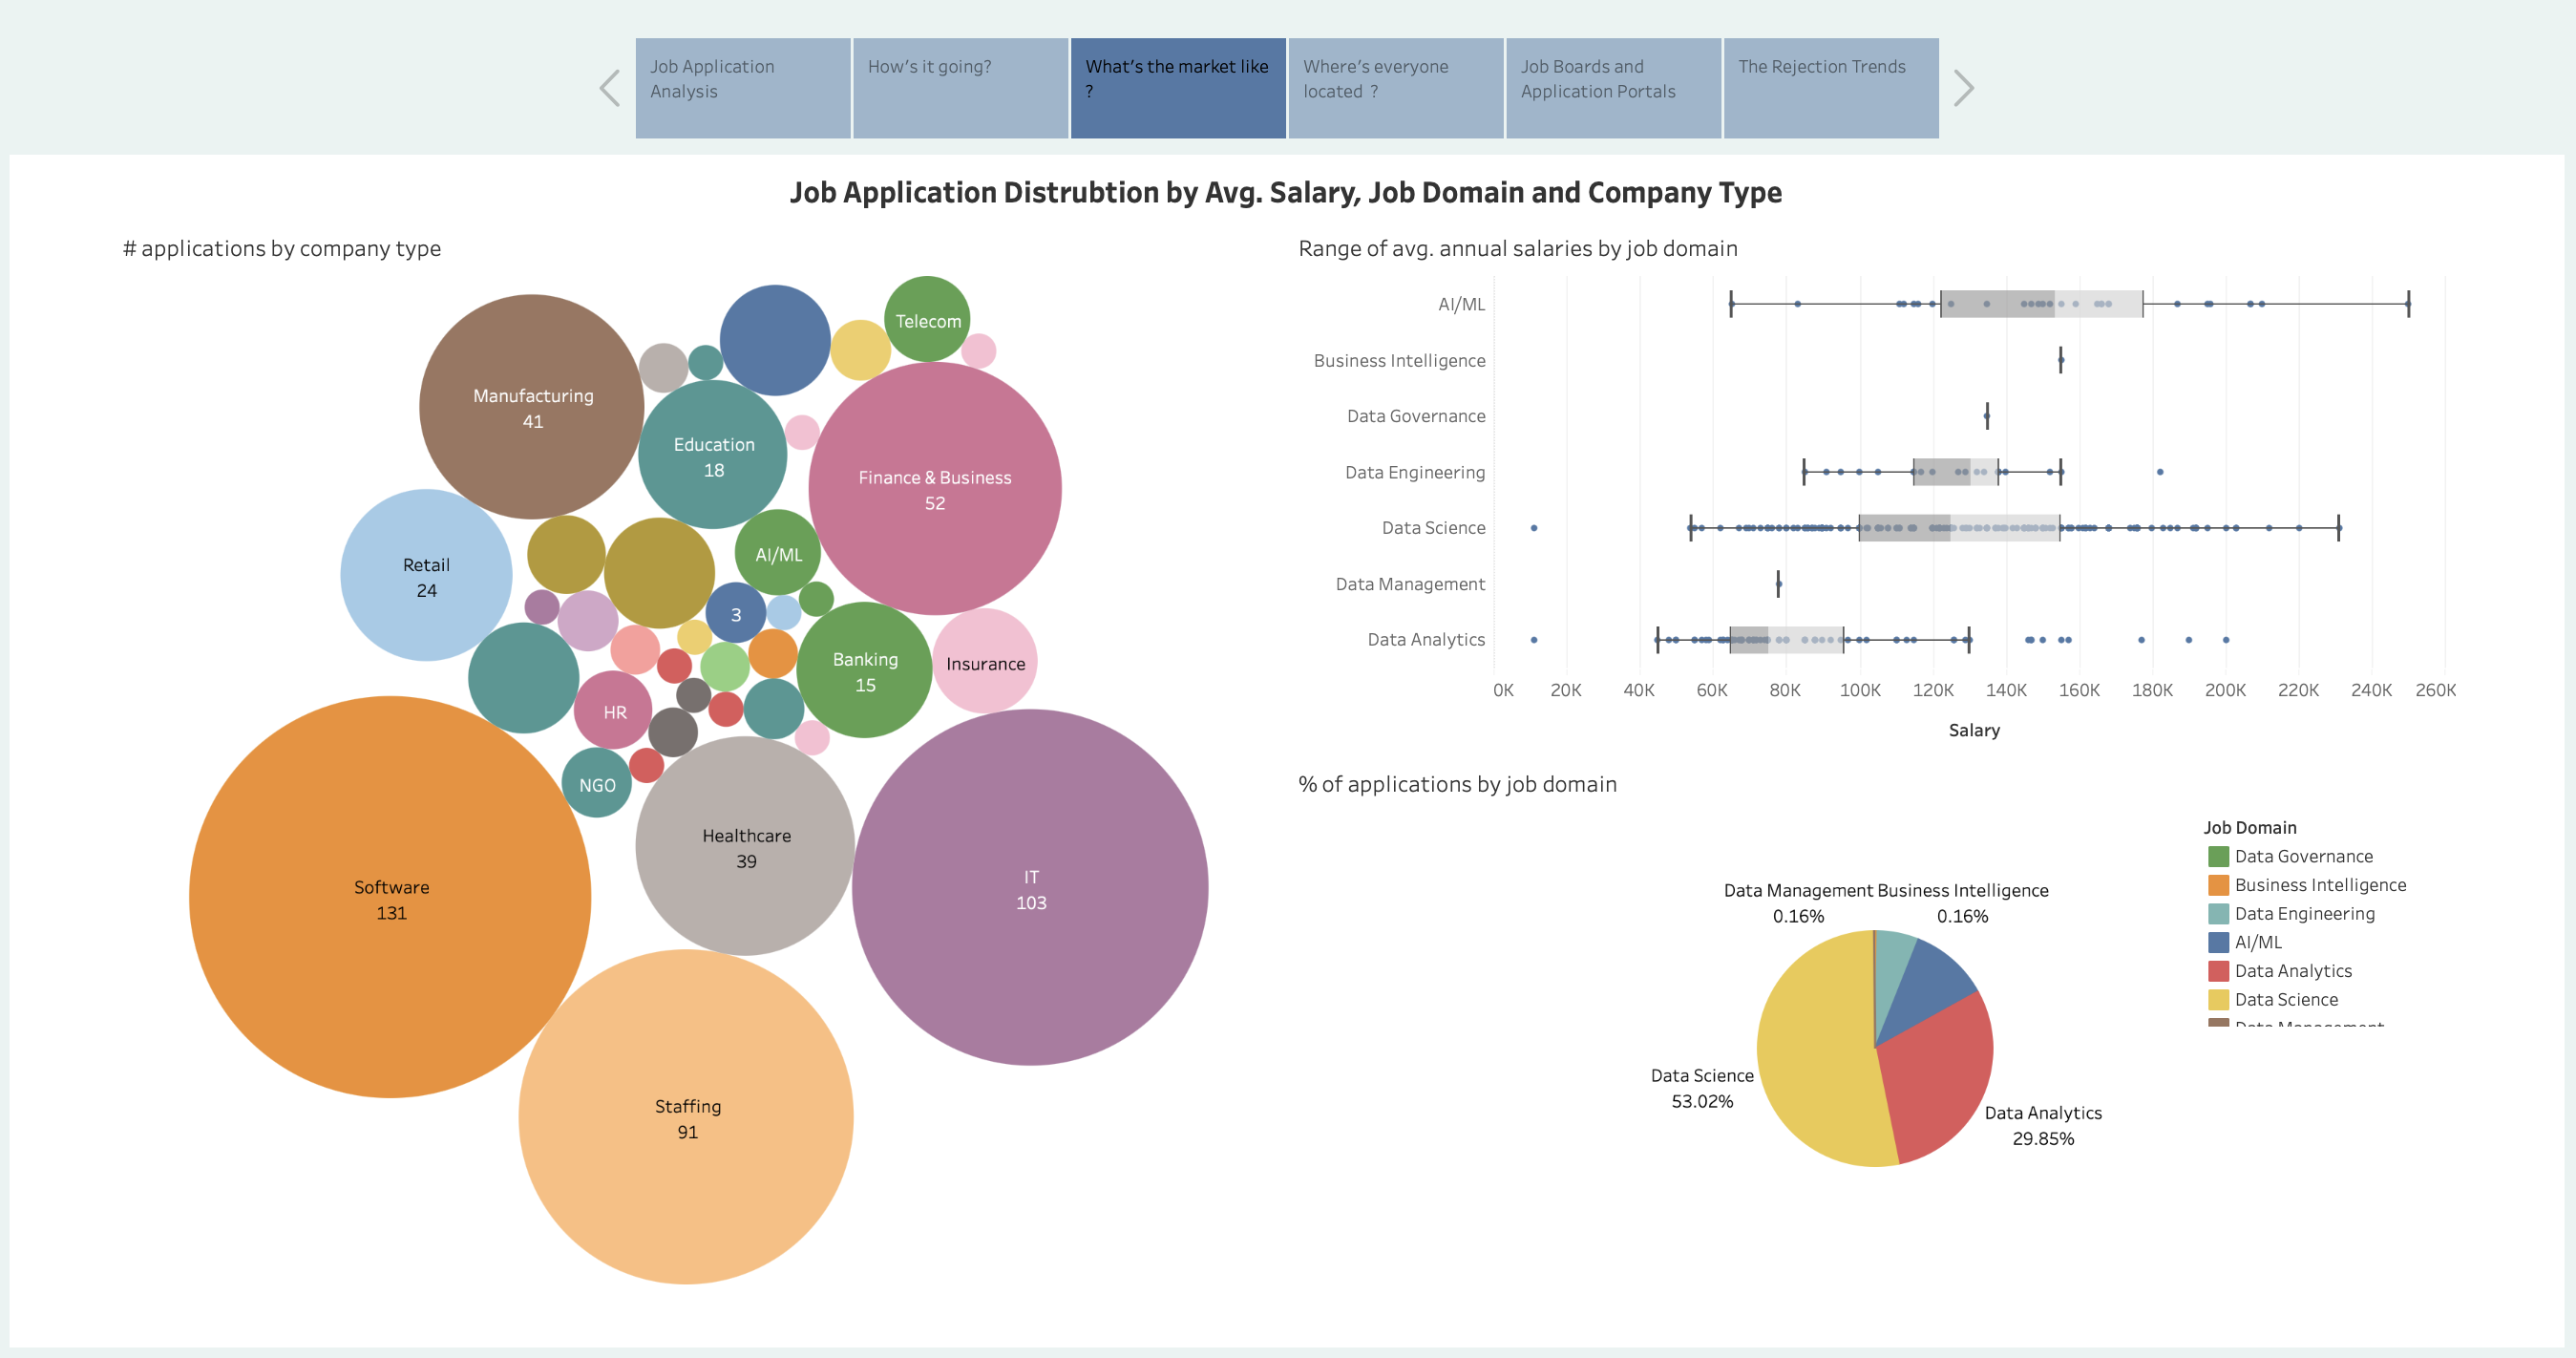
- Exploratory Analysis: Examined initial patterns, distributions, and outliers in the collected data.
- Visualization Development: Created interactive dashboards in Tableau to effectively communicate findings.
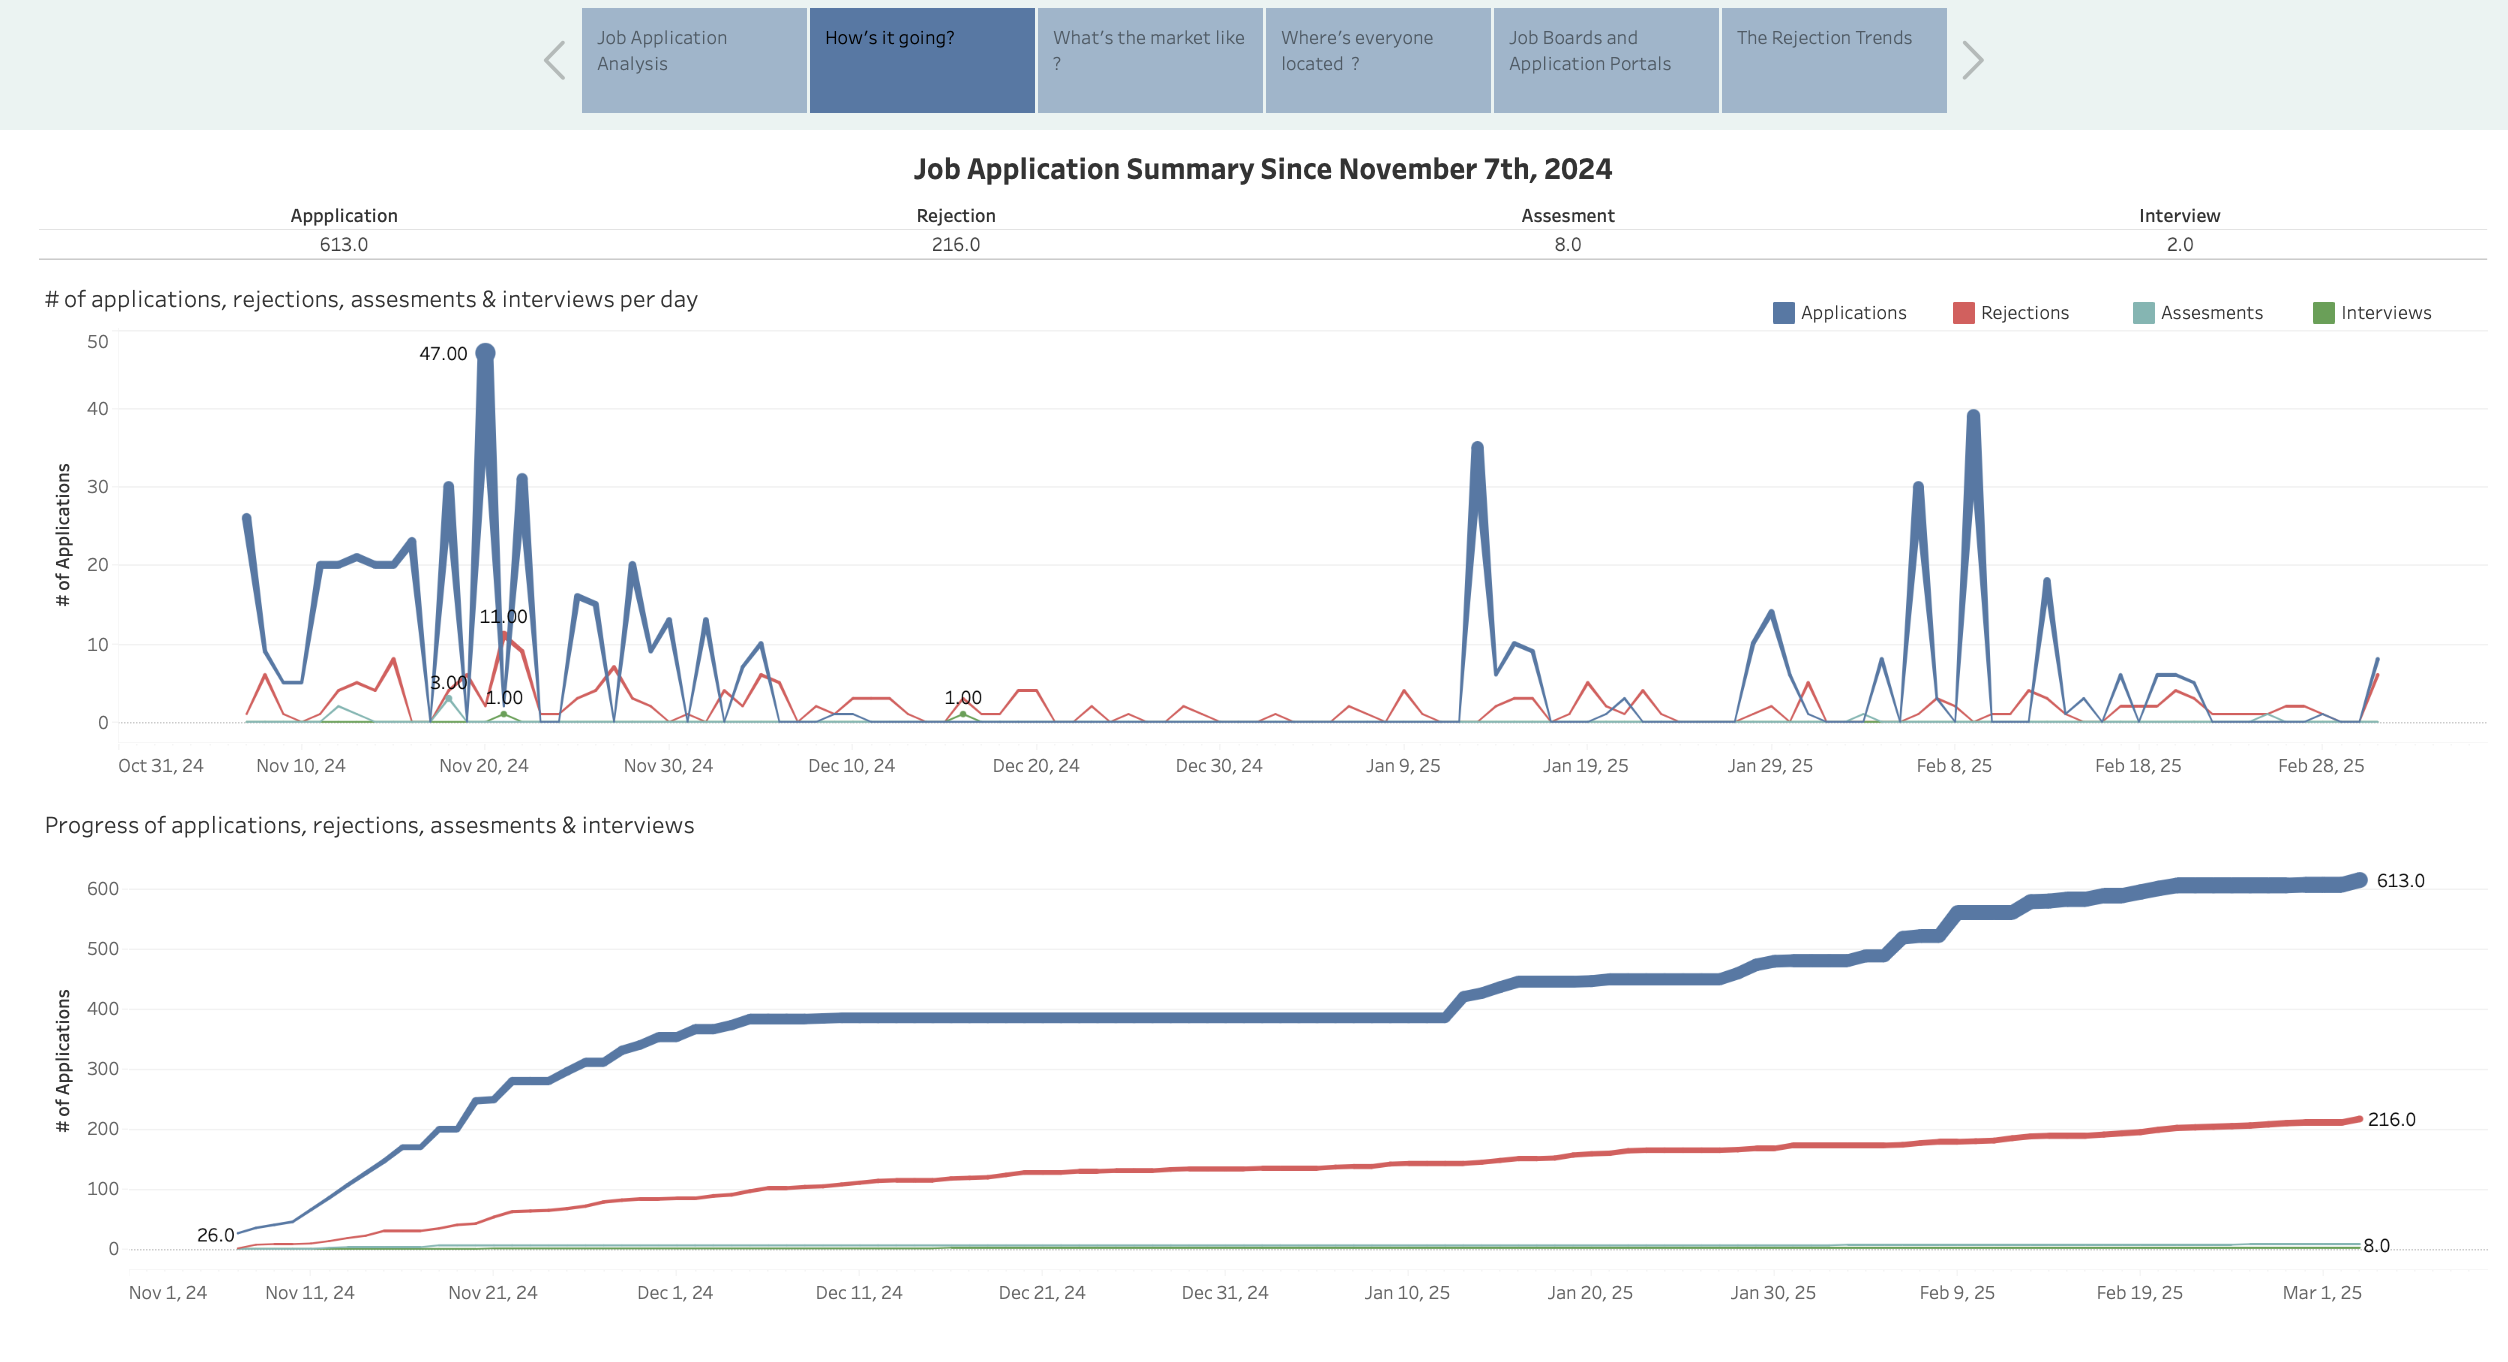
- Temporal Analysis: Tracked application outcomes and employer responses over time to identify timing patterns.
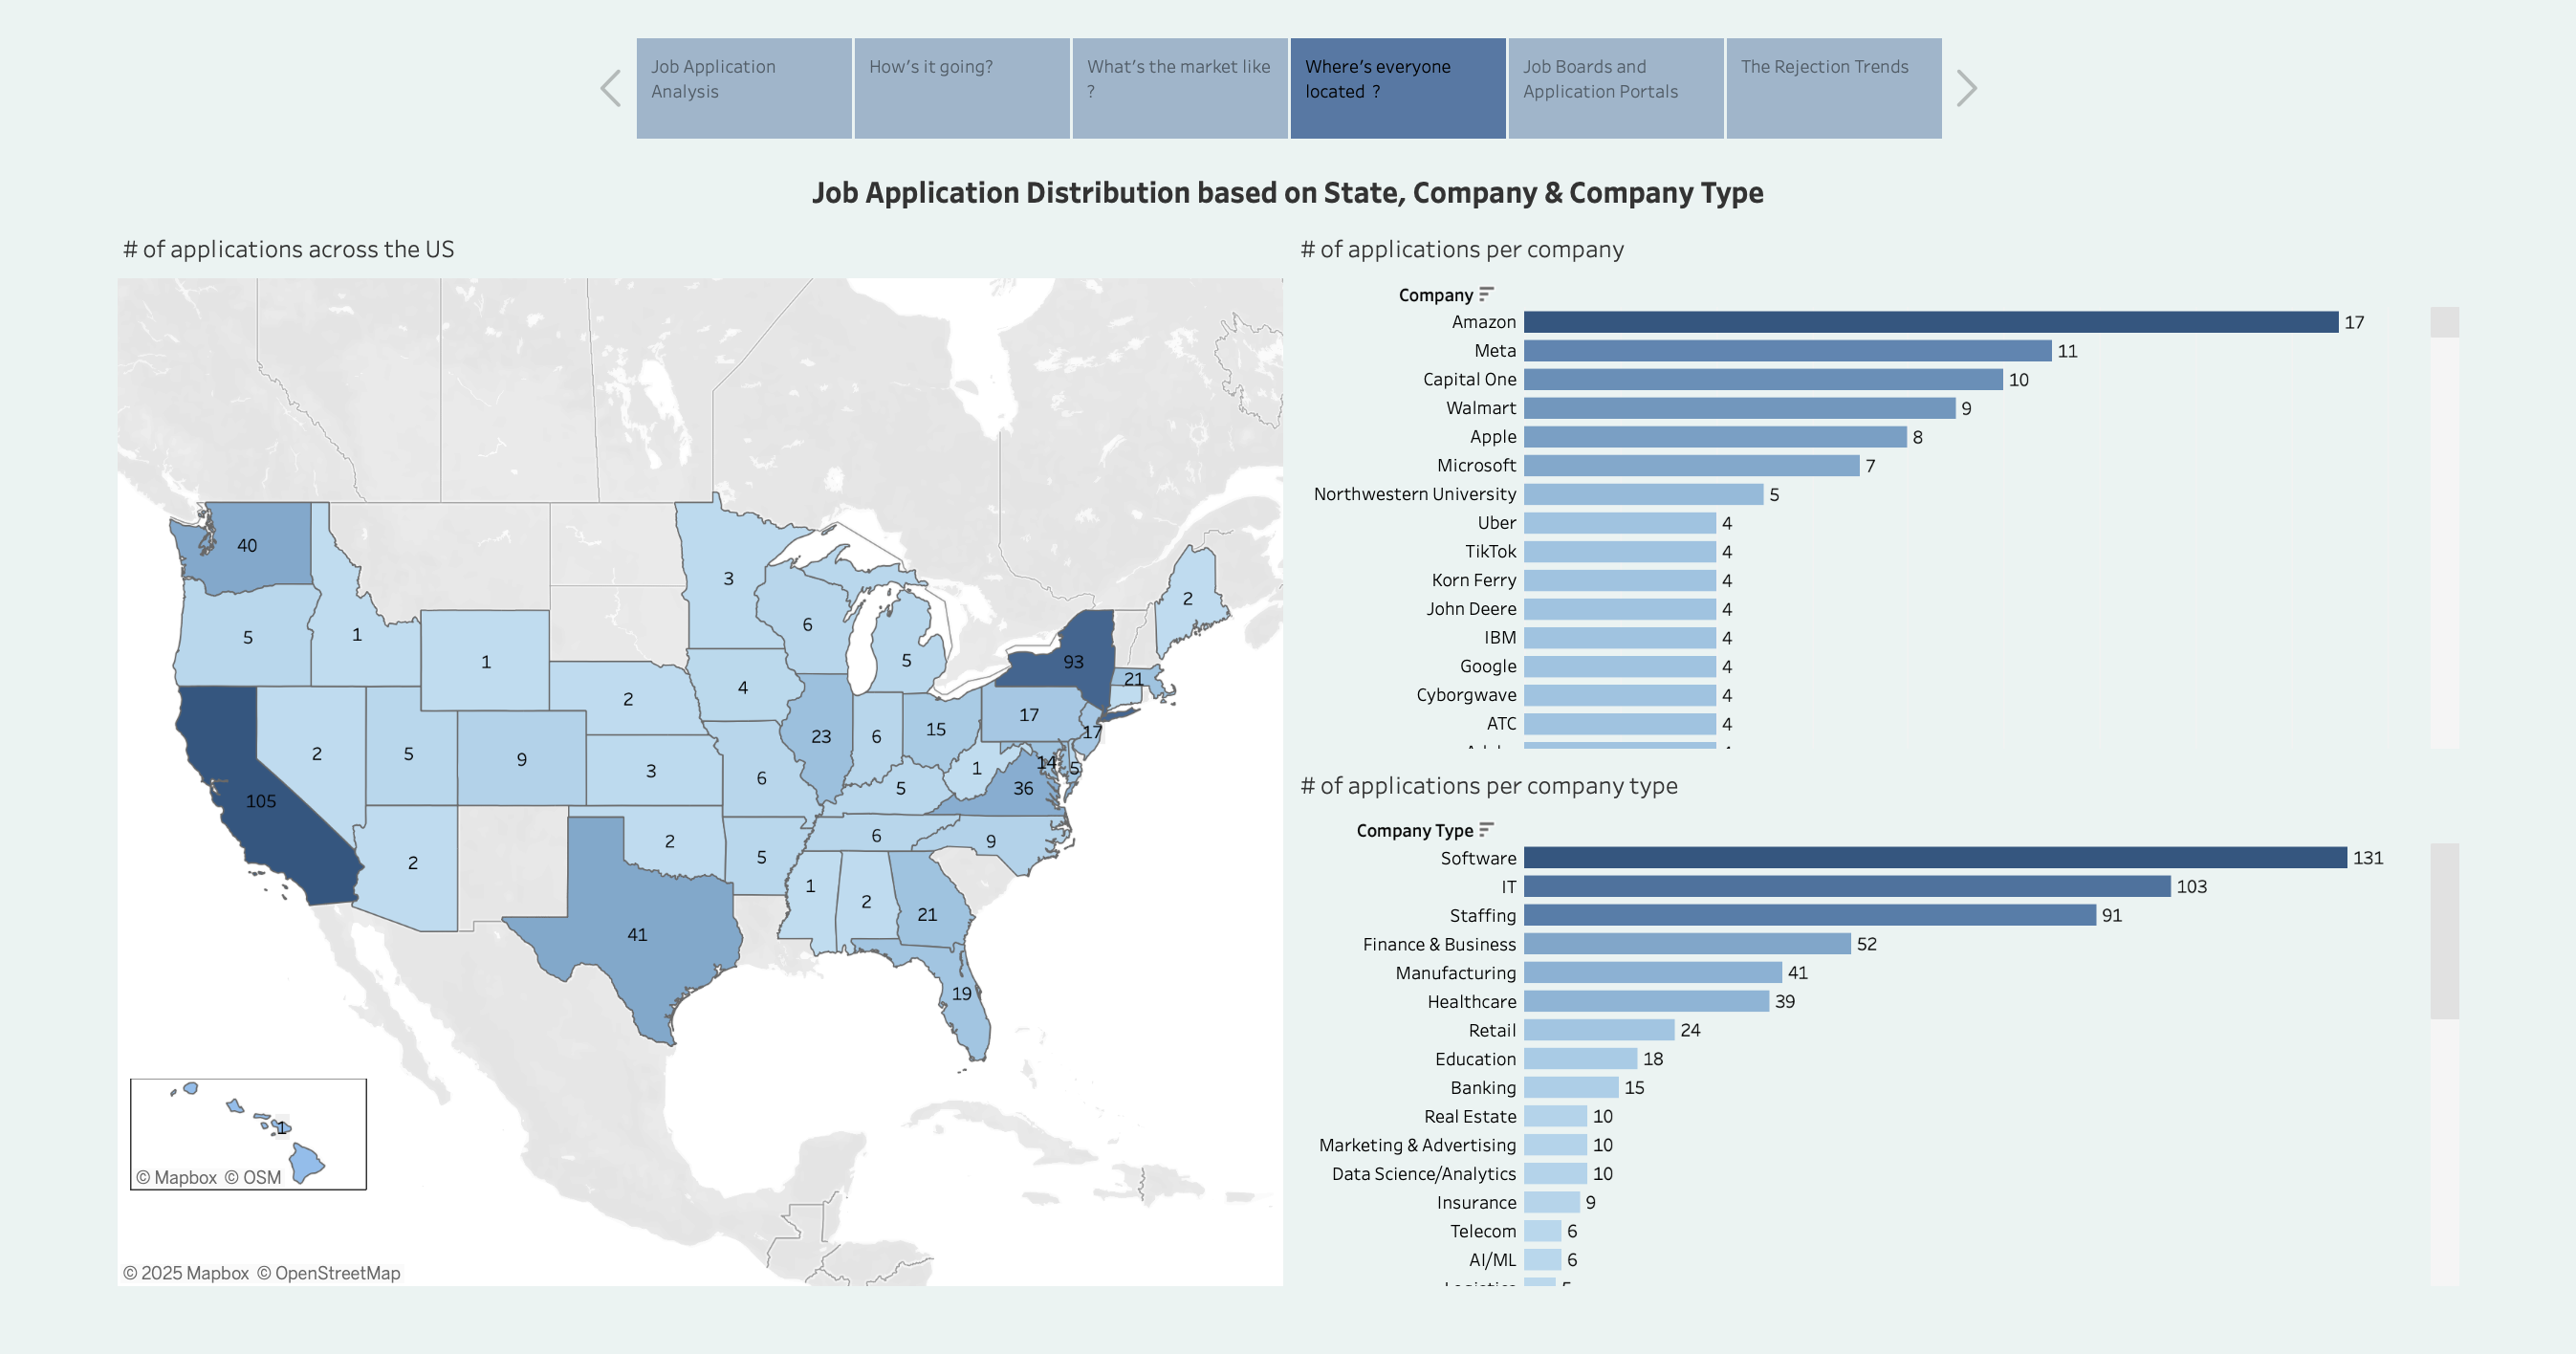
- Geographical Analysis: Mapped application distribution and response rates across different locations.
- Response Pattern Identification: Analyzed communication timelines and patterns from employers.
- Outcome Analysis: Examined success rates across different job types, industries, and requirements.
- Insight Extraction: Derived actionable insights to optimize future application strategies.
Tools and Technologies
The project utilized various tools and technologies to collect, process, and visualize the job application data:
Data Collection:
- Google Sheets
- Custom Tracking System
Data Processing:
- Google Sheets
- Python
- Tableau
Libraries:
- Pandas
- NumPy
Visualization:
- Tableau
Analysis Methods:
- Statistical Analysis
- Time Series Analysis
- Geographic Mapping
- Correlation Analysis
Insights and Applications
This project demonstrates the power of data-driven approaches in understanding and optimizing the job search process. By systematically tracking and analyzing job application data, valuable insights emerge that can significantly improve application strategies.
The visualizations and analysis provide practical benefits such as identifying the most responsive industries, optimal application timing, effective qualification presentation, and promising geographical markets. These insights can help job seekers make more informed decisions, allocate their time efficiently, and improve their chances of securing desirable positions.
Beyond personal benefits, this methodology can be expanded to larger datasets to identify broader job market trends, inform career development strategies, and provide insights for educational institutions preparing students for the workforce.